Open to opportunities

Rachit Jain

|

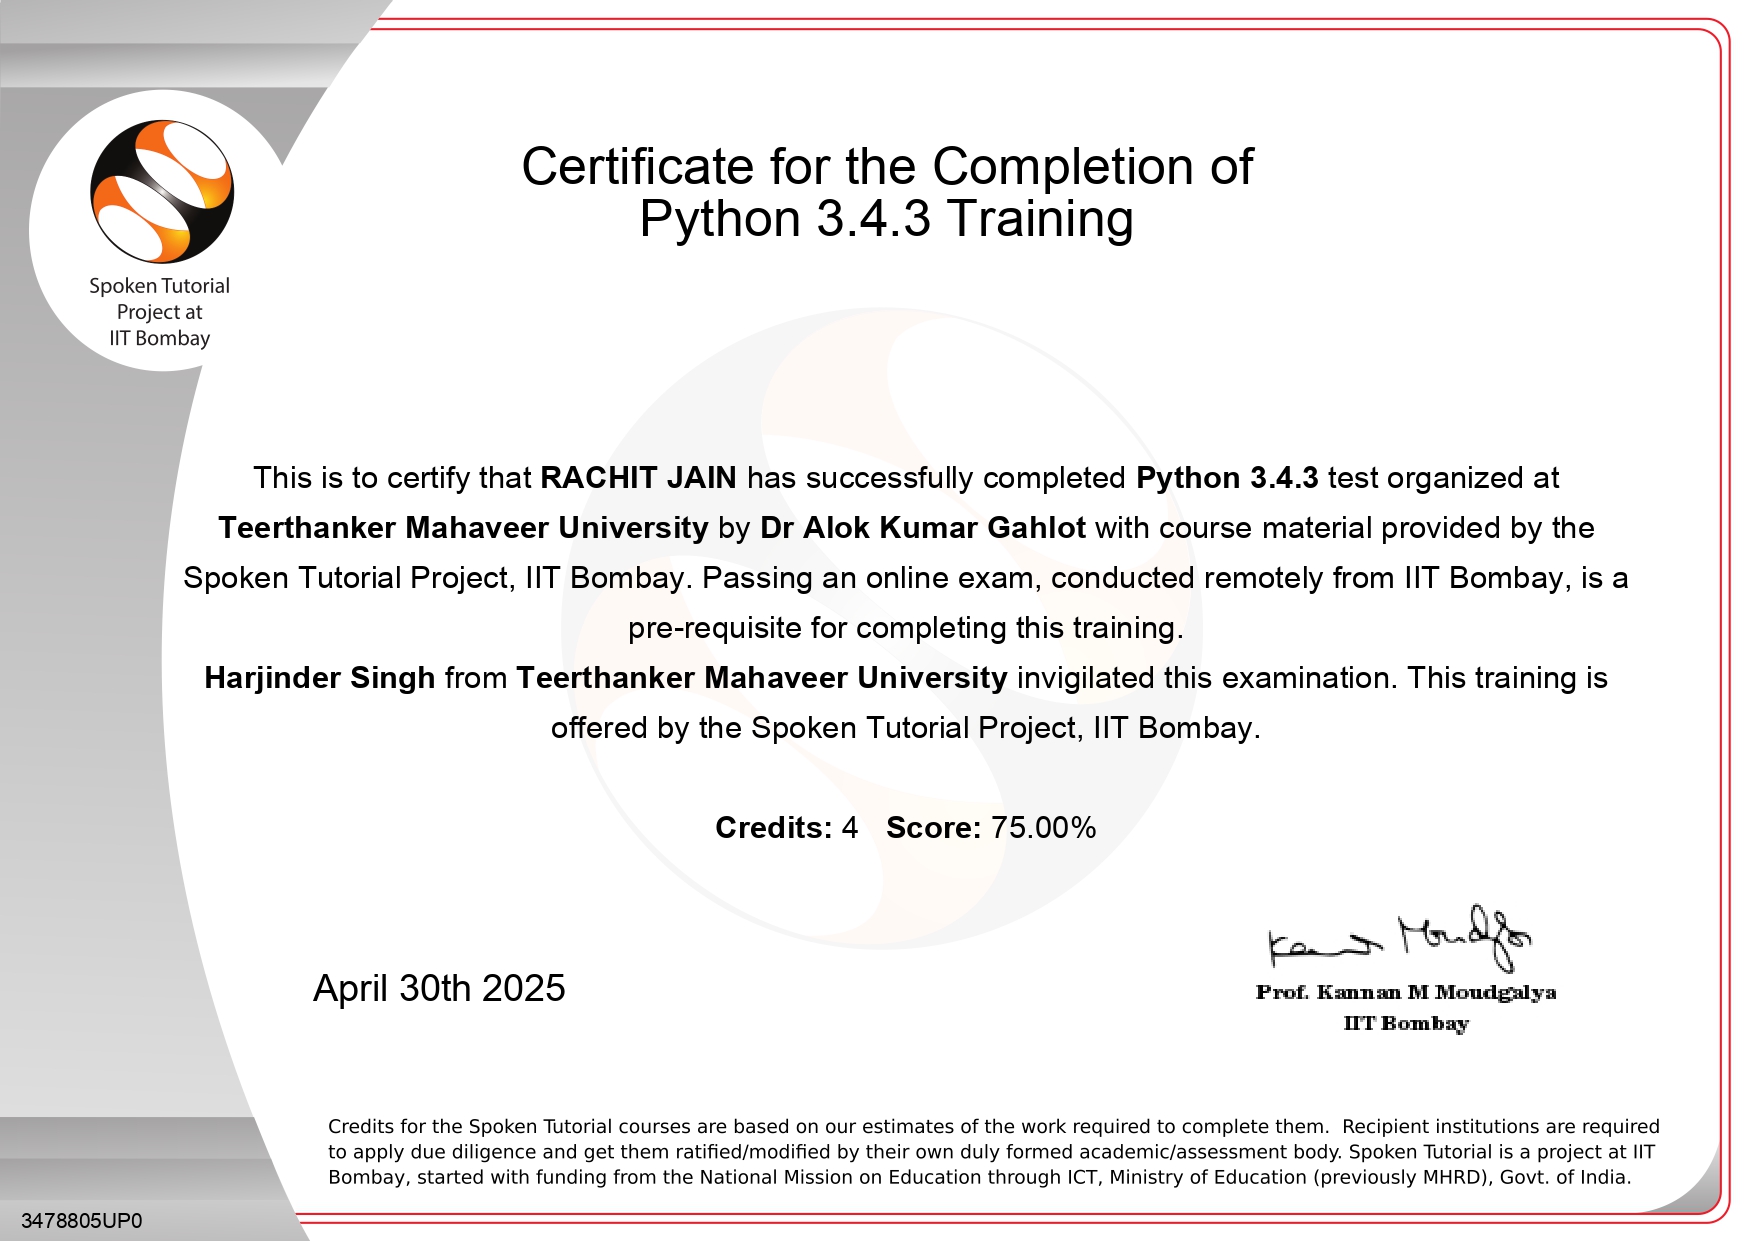
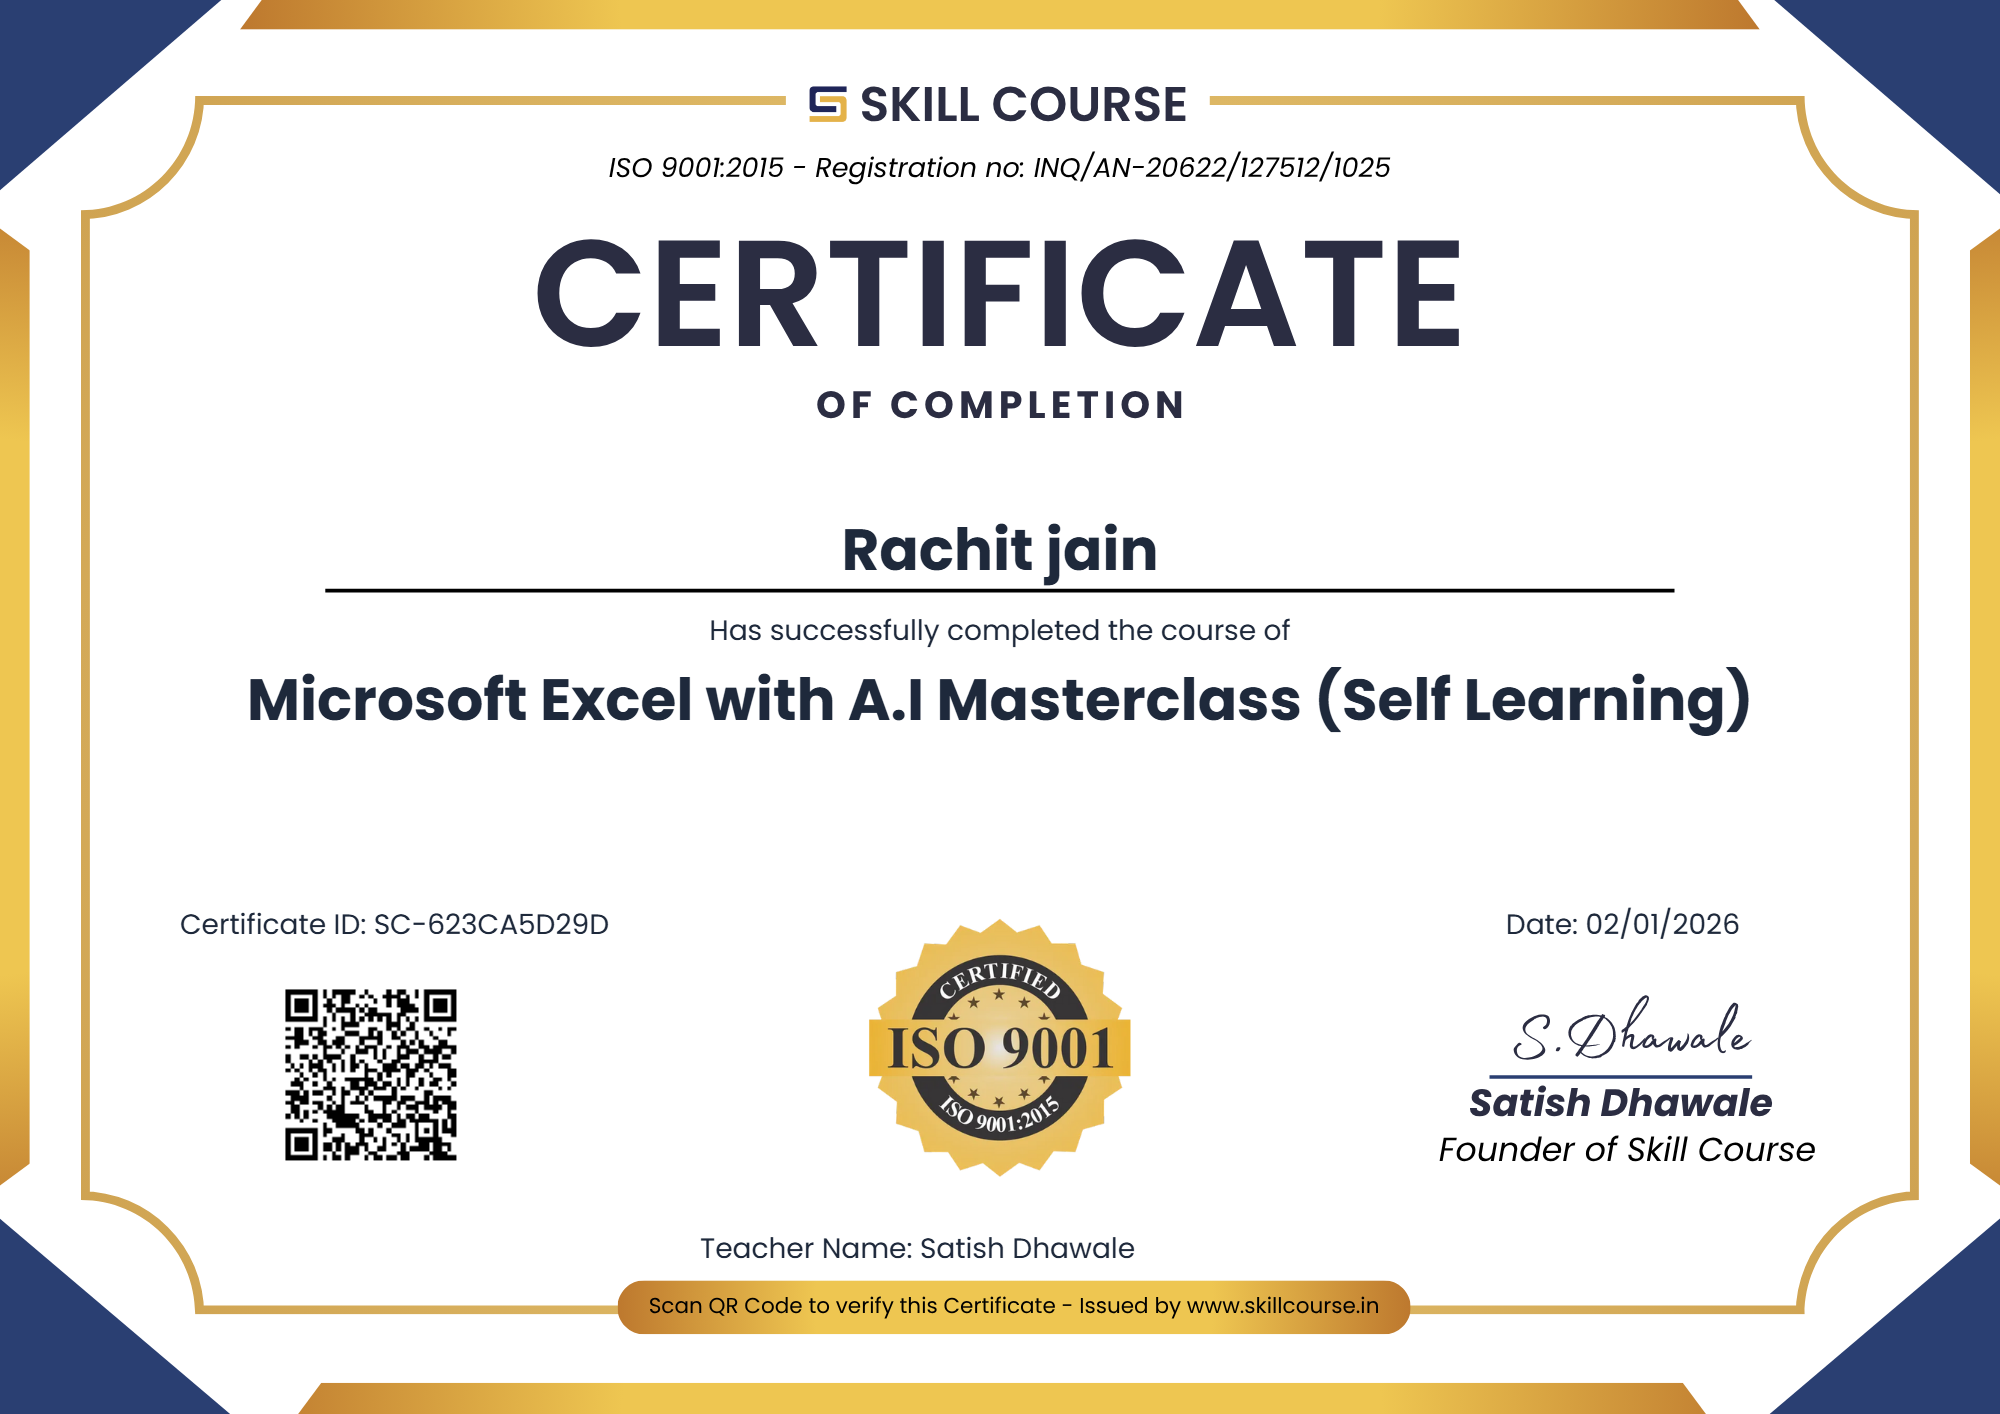
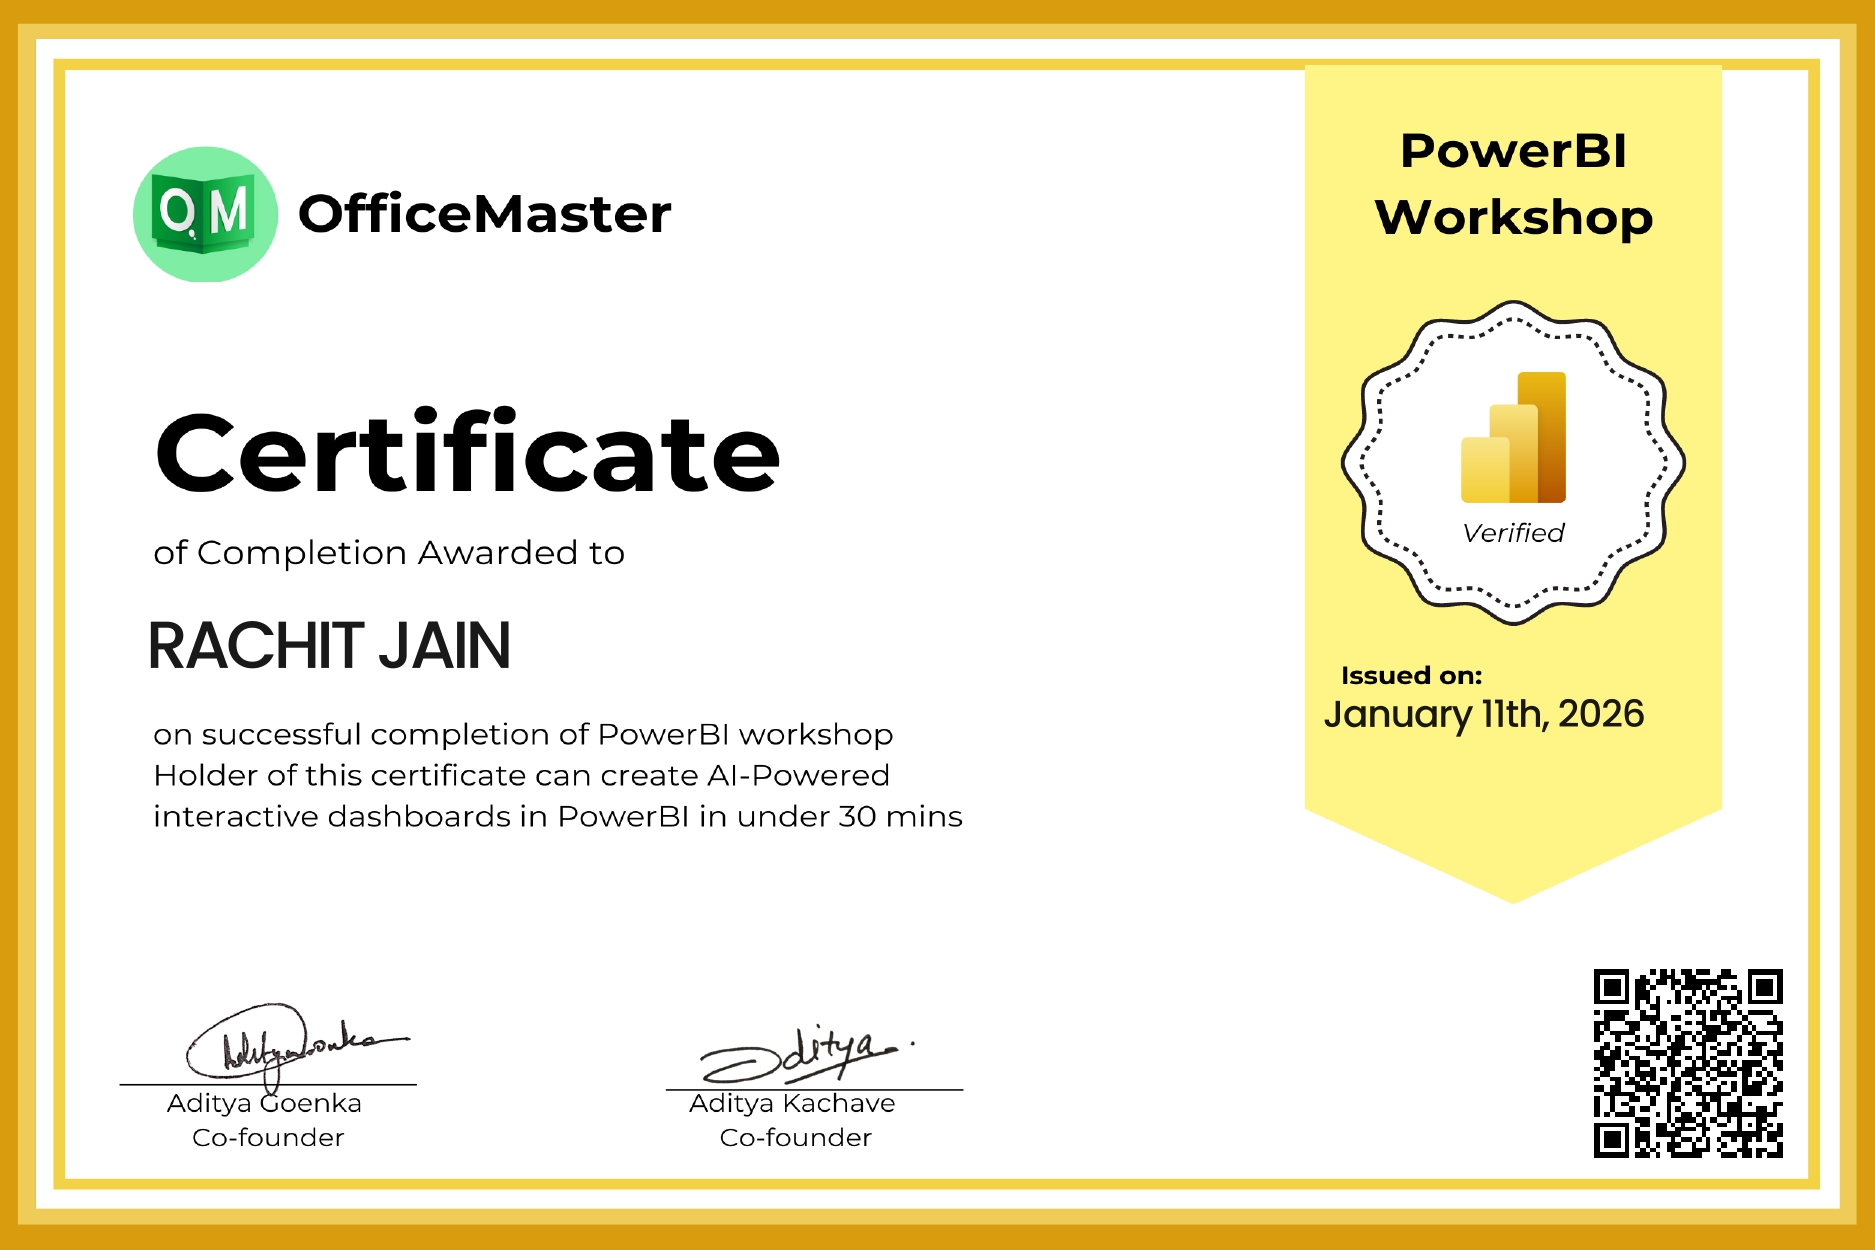
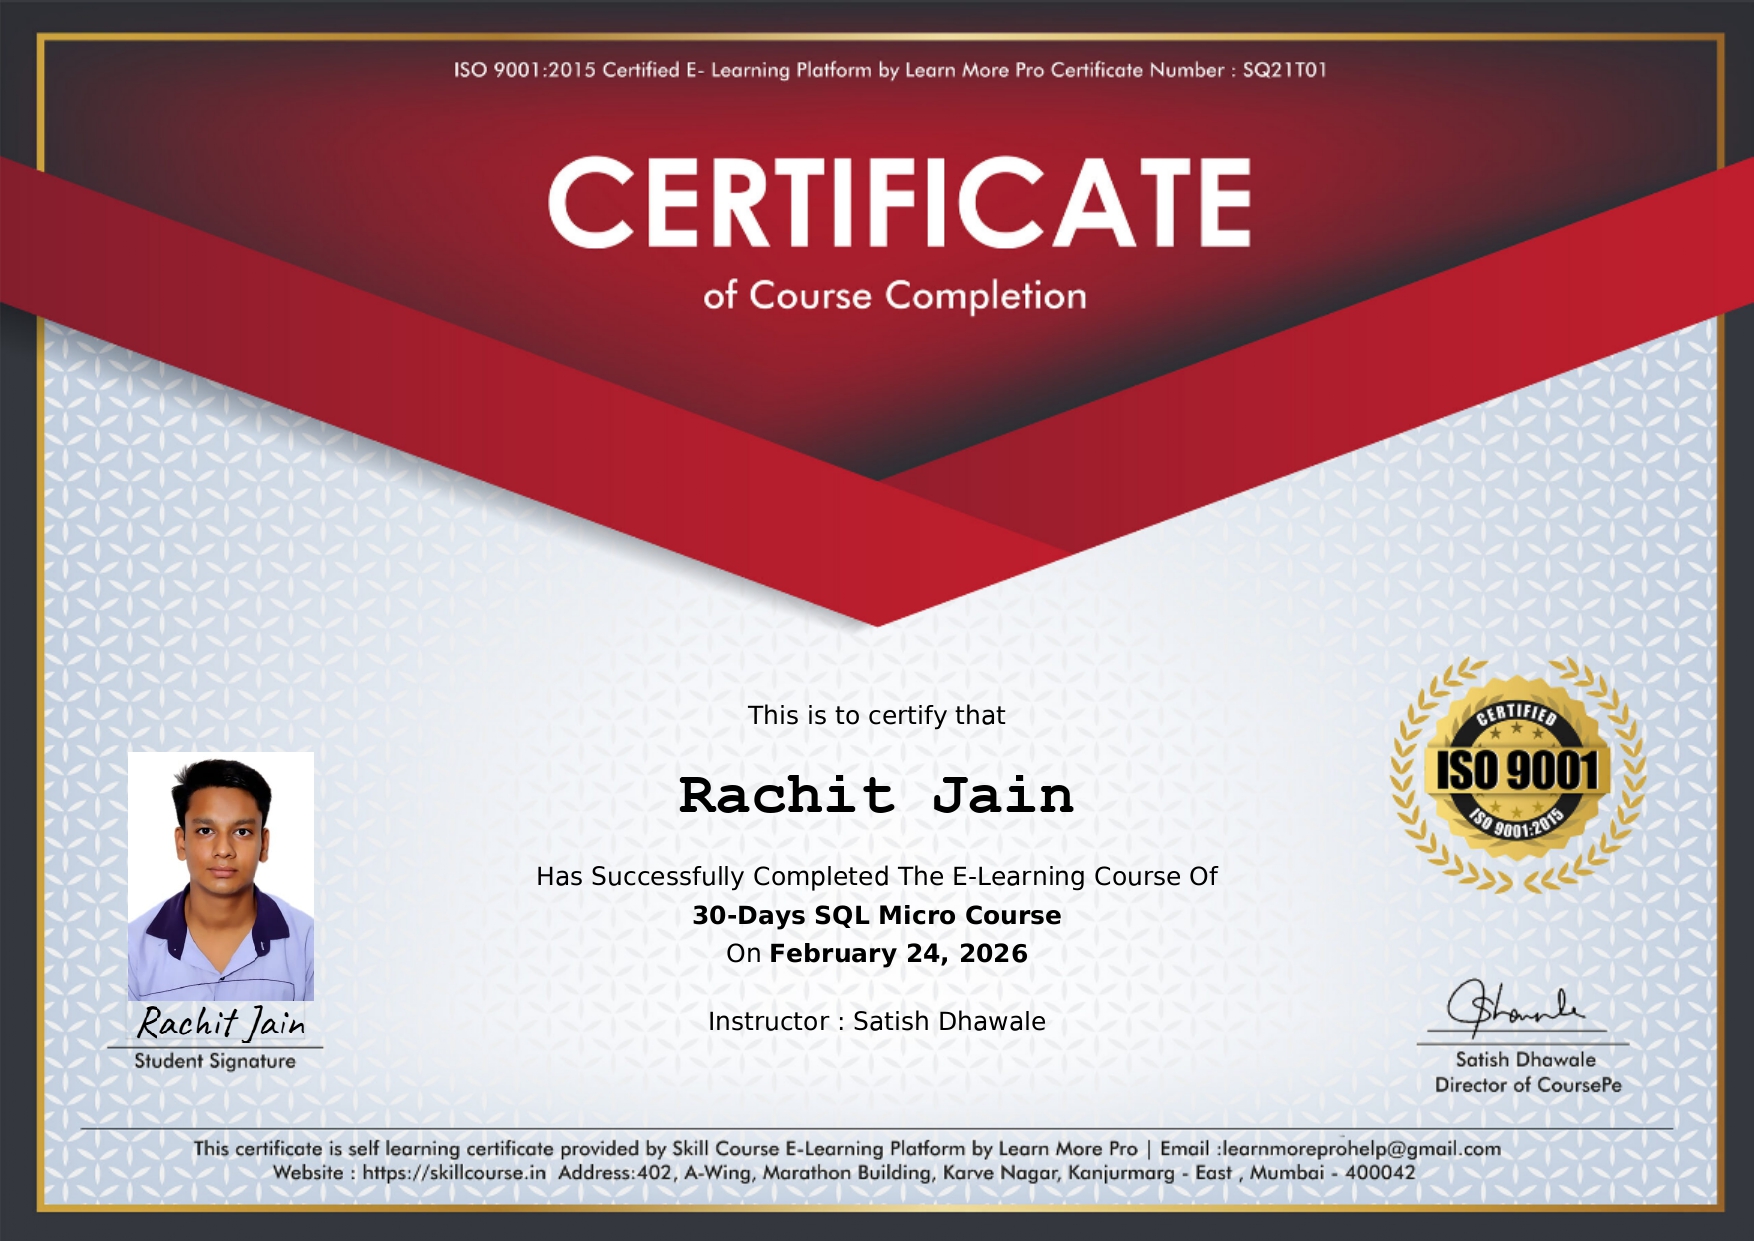
Turning raw data into clear, actionable business insights with SQL, Python, Power BI, Excel & Tableau.

Rachit Jain
📊
BCA 78.3%
Teerthanker Mahaveer University

About Me

Results-driven Data Analyst with hands-on experience analyzing large transactional and customer datasets using PostgreSQL, Python, Advanced Excel, and Power BI.

Strong expertise in SQL analytics, data modeling, KPI engineering, RFM segmentation, cohort analysis, and dashboard automation.

Delivered Measurable Impacts: Improved reporting efficiency by up to 45%, Optimized SQL query performance by 25%, And provided actionable insights that support strategic, data-driven business decisions.

2025
Graduated
78.3%
BCA
Connect on LinkedIn

Experience

Practical Exposure & Internships

Data Analyst Intern (MIS & Operations)

Leo Sales Corporation

Mar 2026 – Present On-site

  • Analyzed daily sales and operational data using Excel, SQL, and Power BI to generate MIS reports
  • Automated reporting processes, reducing manual effort and improving efficiency
  • Created dashboards to track KPIs such as sales performance, inventory, and trends
  • Cleaned and validated large datasets to ensure data accuracy and consistency
MS Excel MSSQL PYTHON POWER BI

Web Development Intern

CodSoft

Jun – Jul 2024 Virtual

  • Designed and built responsive web pages using HTML5, CSS3, and JavaScript with a mobile-first approach
  • Implemented dynamic user interactions and robust form validation logic to improve usability and data integrity
  • Followed best practices for clean, semantic code structure; performed debugging and comprehensive cross-browser testing
  • Acquired practical Git skills including version control workflows, branching, merging, and basic deployment processes
HTML5 CSS3 JavaScript Git
Certificate

Skills

PostgreSQL

Python

Advanced Excel

Power BI

Tableau

Looker Studio

Snowflake

Microsoft Azure

ETL Pipelines

Statistics

Git

GitHub

Prompt Engineering

Featured Projects

End-To-End Analytics Projects Delivering Measurable Business Value

📊

Revenue & Business Performance Analysis

Analyzed and transformed 11K records using PostgreSQL, built interactive Power BI dashboards for performance tracking, and generated actionable insights to support data-driven strategic decisions effectively.

Excel PostgreSQL Power BI
GitHub
📦

Inventory Optimization & Demand Analysis

Analyzed 250K SKU records using PostgreSQL, identified demand trends, stock inefficiencies, and supplier gaps, leveraging advanced SQL and automated reporting for actionable business insights.

Excel PostgreSQL
GitHub
👥

Customer Segmentation & Retention

Analyzed 600K transactions and 200K customers, applied RFM and cohort analysis to identify high-value and at-risk segments, and built Python and Power BI dashboards for actionable insights.

Excel Python Power BI
GitHub
📣

ShopKart Sales, Marketing & Customer Intelligence Analytics

Analyzed large-scale e-commerce sales, customer behavior, and marketing campaigns using Snowflake, SQL, and Power BI to identify revenue trends, high-value customers, ROI, and product demand.

Snowflake SQL Power BI
GitHub
🛒

Amazon Sales Performance & Order Analytics Dashboard

Analyzed Amazon e-commerce sales, order trends, product demand, and regional performance using Excel and Tableau to identify sales patterns, fulfillment efficiency, and top-performing categories and states.

Excel Tableau
GitHub

Certifications

Verified Credentials In Data Tools & Programming

Python IIT Bombay

Python 3.4.3 Training

IIT Bombay – Spoken Tutorial • 2025

Qualified with 75% in examination

Download Certificate
Excel with AI

Microsoft Excel With A.I

SkillCourse • 2026

Advanced Excel + AI analytics features

Download Certificate
Power BI Workshop

Power BI Workshop

OfficeMaster • 2026

AI-powered interactive dashboards

Download Certificate
PostgreSQL

PostgreSQL

SkillCourse • 2026

Relational database & SQL skills

Download Certificate

Let's Connect